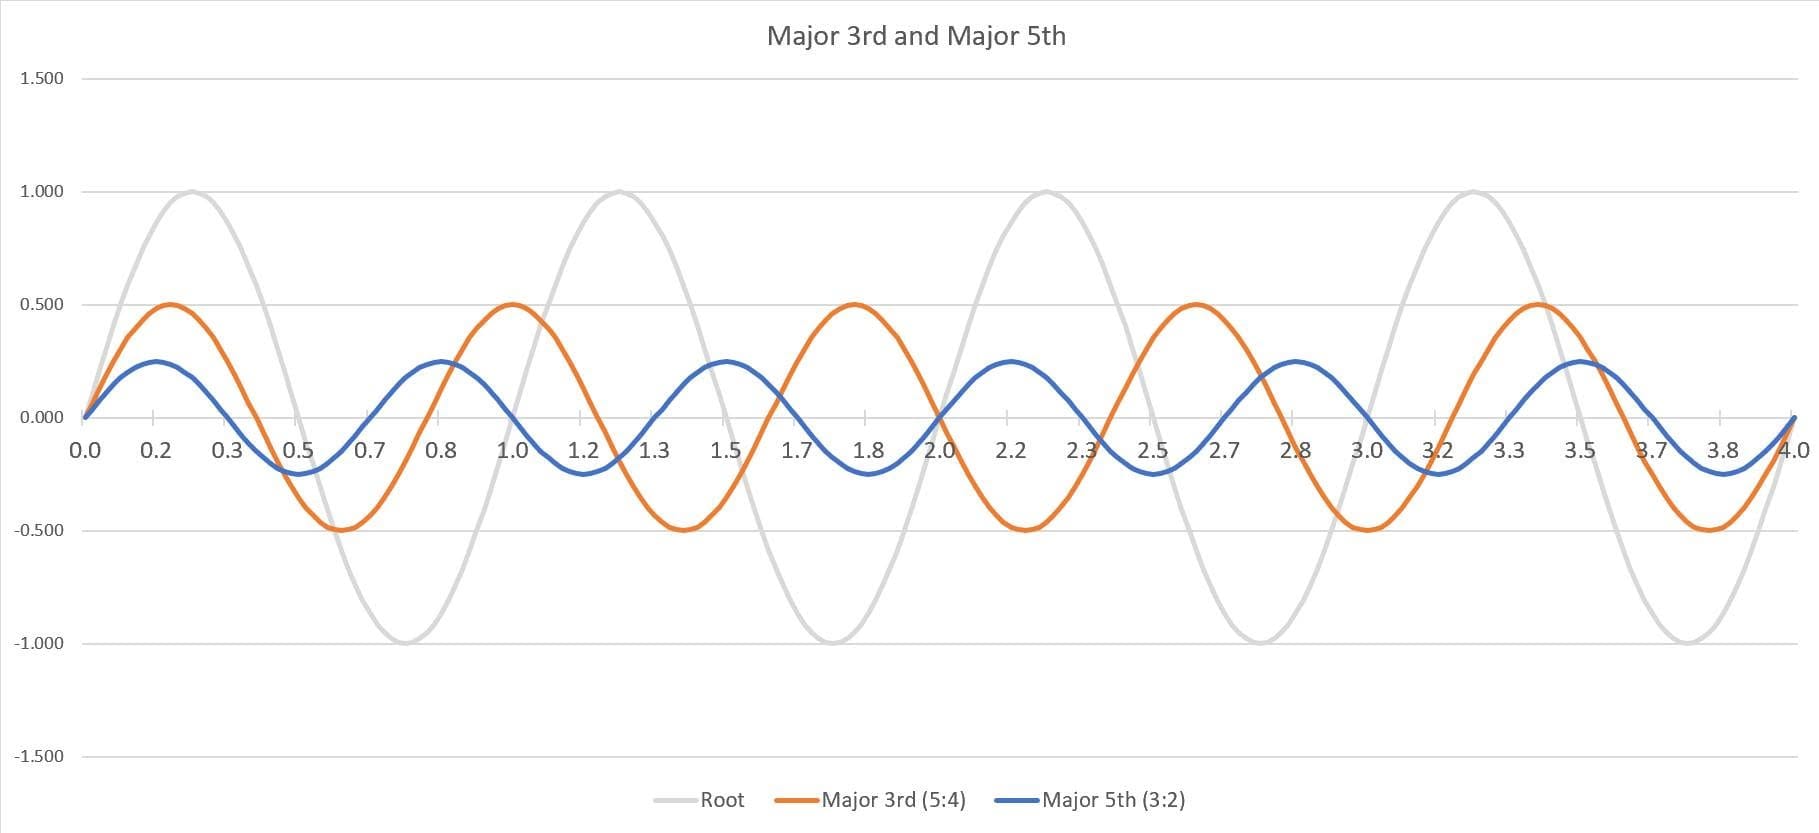
Harmonic Series

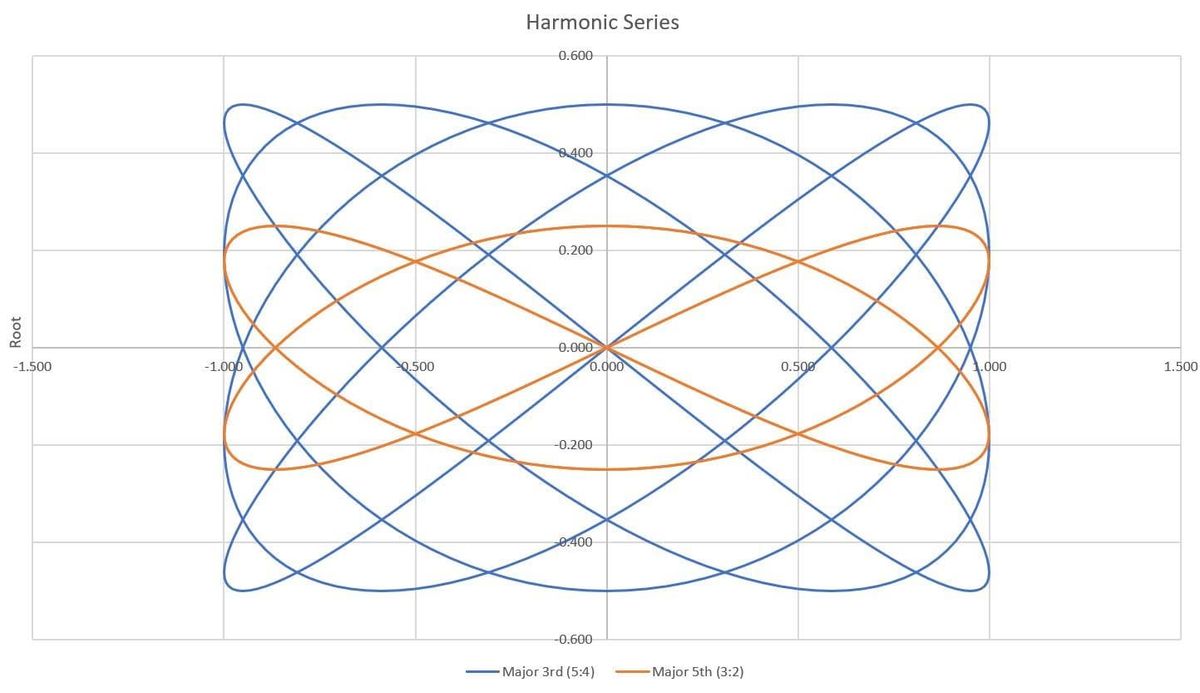
I plotted the harmonic series for a major triad, 3rd and 5th against the root. This is what a major chord looks like mathematically.
This is just plotting the sine waves for a major triad chord (root, 3rd, 5th). The 3rd is a ratio of 5/4. The fifth is a ratio of 3/2. If you plot the sine of these functions over time using a simple line graph it just looks like sine waves at those 3 frequencies. But if you use an XY graph, plotting the 3rd and 5th against the root, you get my picture. The Y axis is the root. The X axis is the 3rd and 5th. Note I lowered the 3rd and 5th amplitudes to see them more clearly.
I'm sure you already know what the graph is showing. A major 3rd means that its frequency makes 5 cycles for every 4 of the root. A major 5th means it makes 3 cycles for every 2 of the root. This is why they sound so good, because the waves converge at a fixed rate.